← All work

Case study

ProField Dashboards

Bring field operations into focus across the people and workflows behind smart-meter deployment.
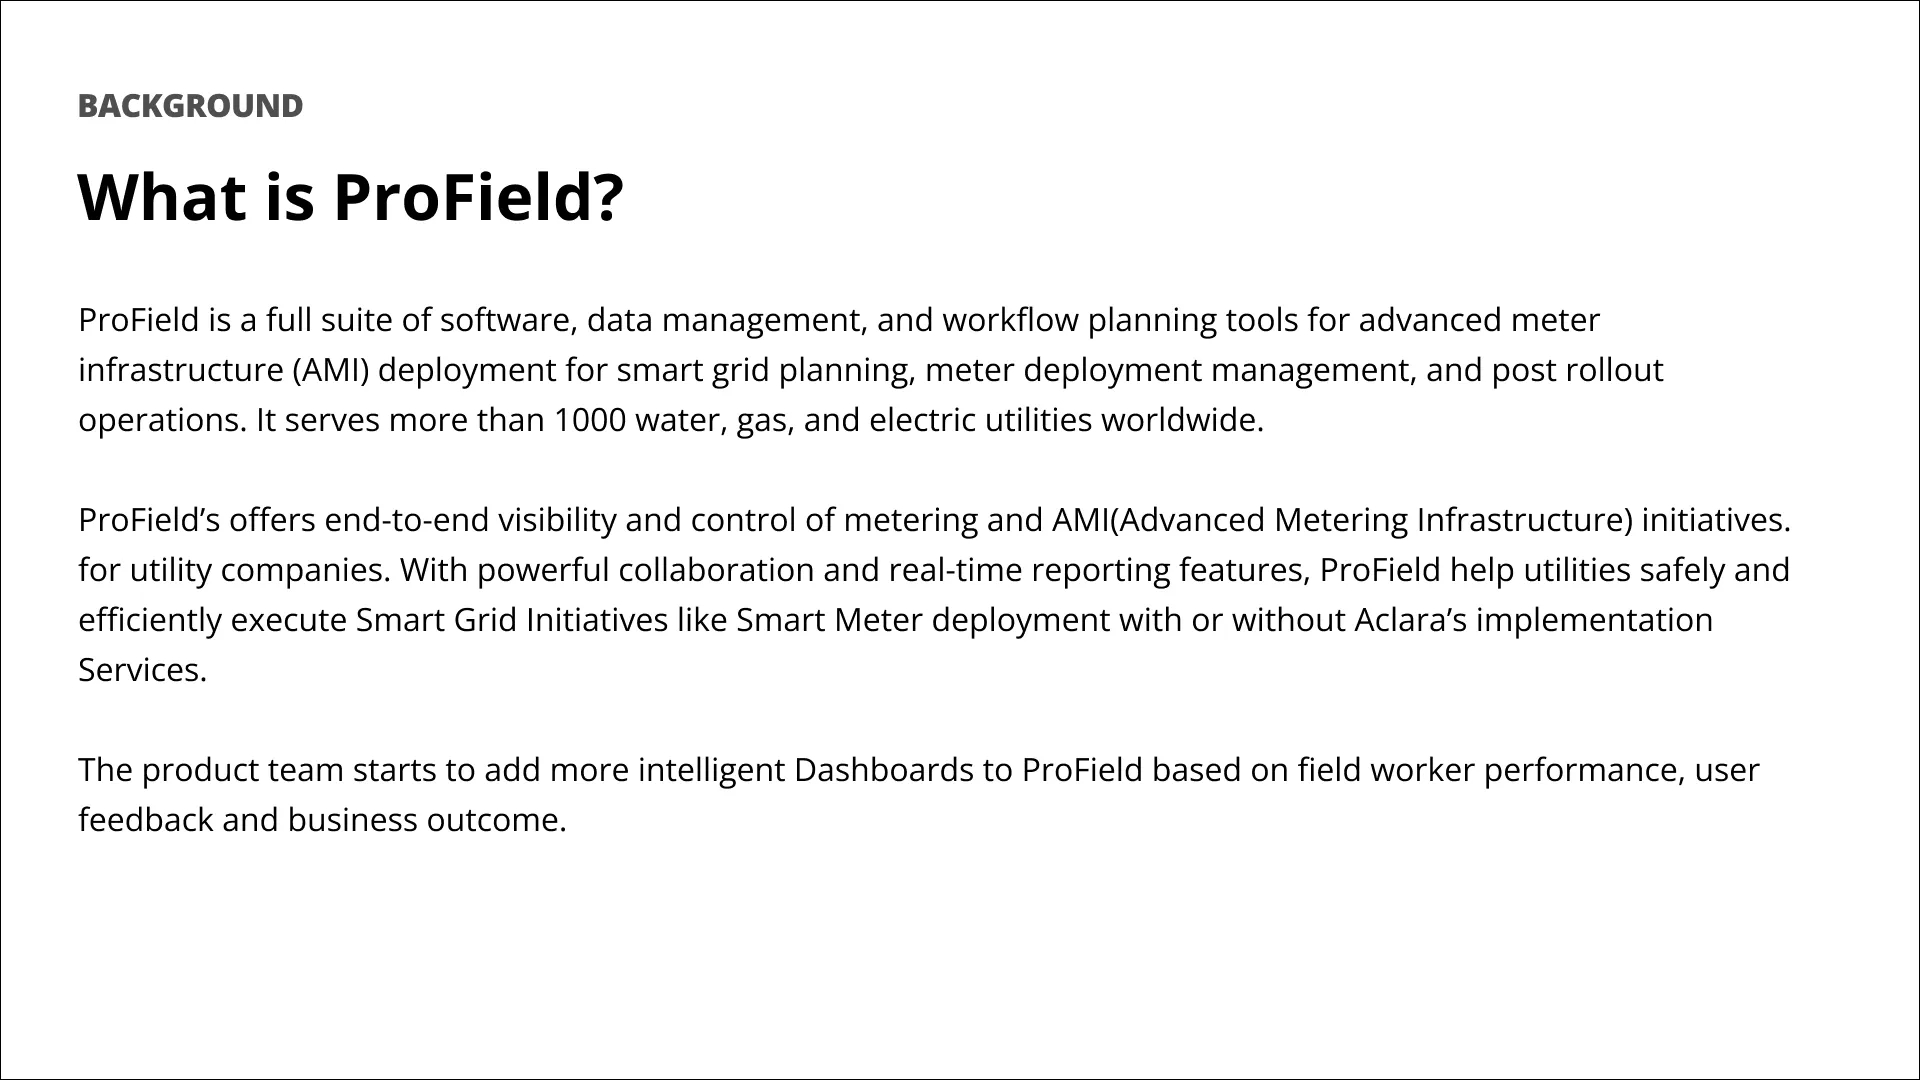
Slide: What is ProField? Background on the AMI deployment suite serving more than 1000 water, gas, and electric utilities

Slide: the problem — how might we augment managerial staff’s effectiveness and decision-making in managing field services?

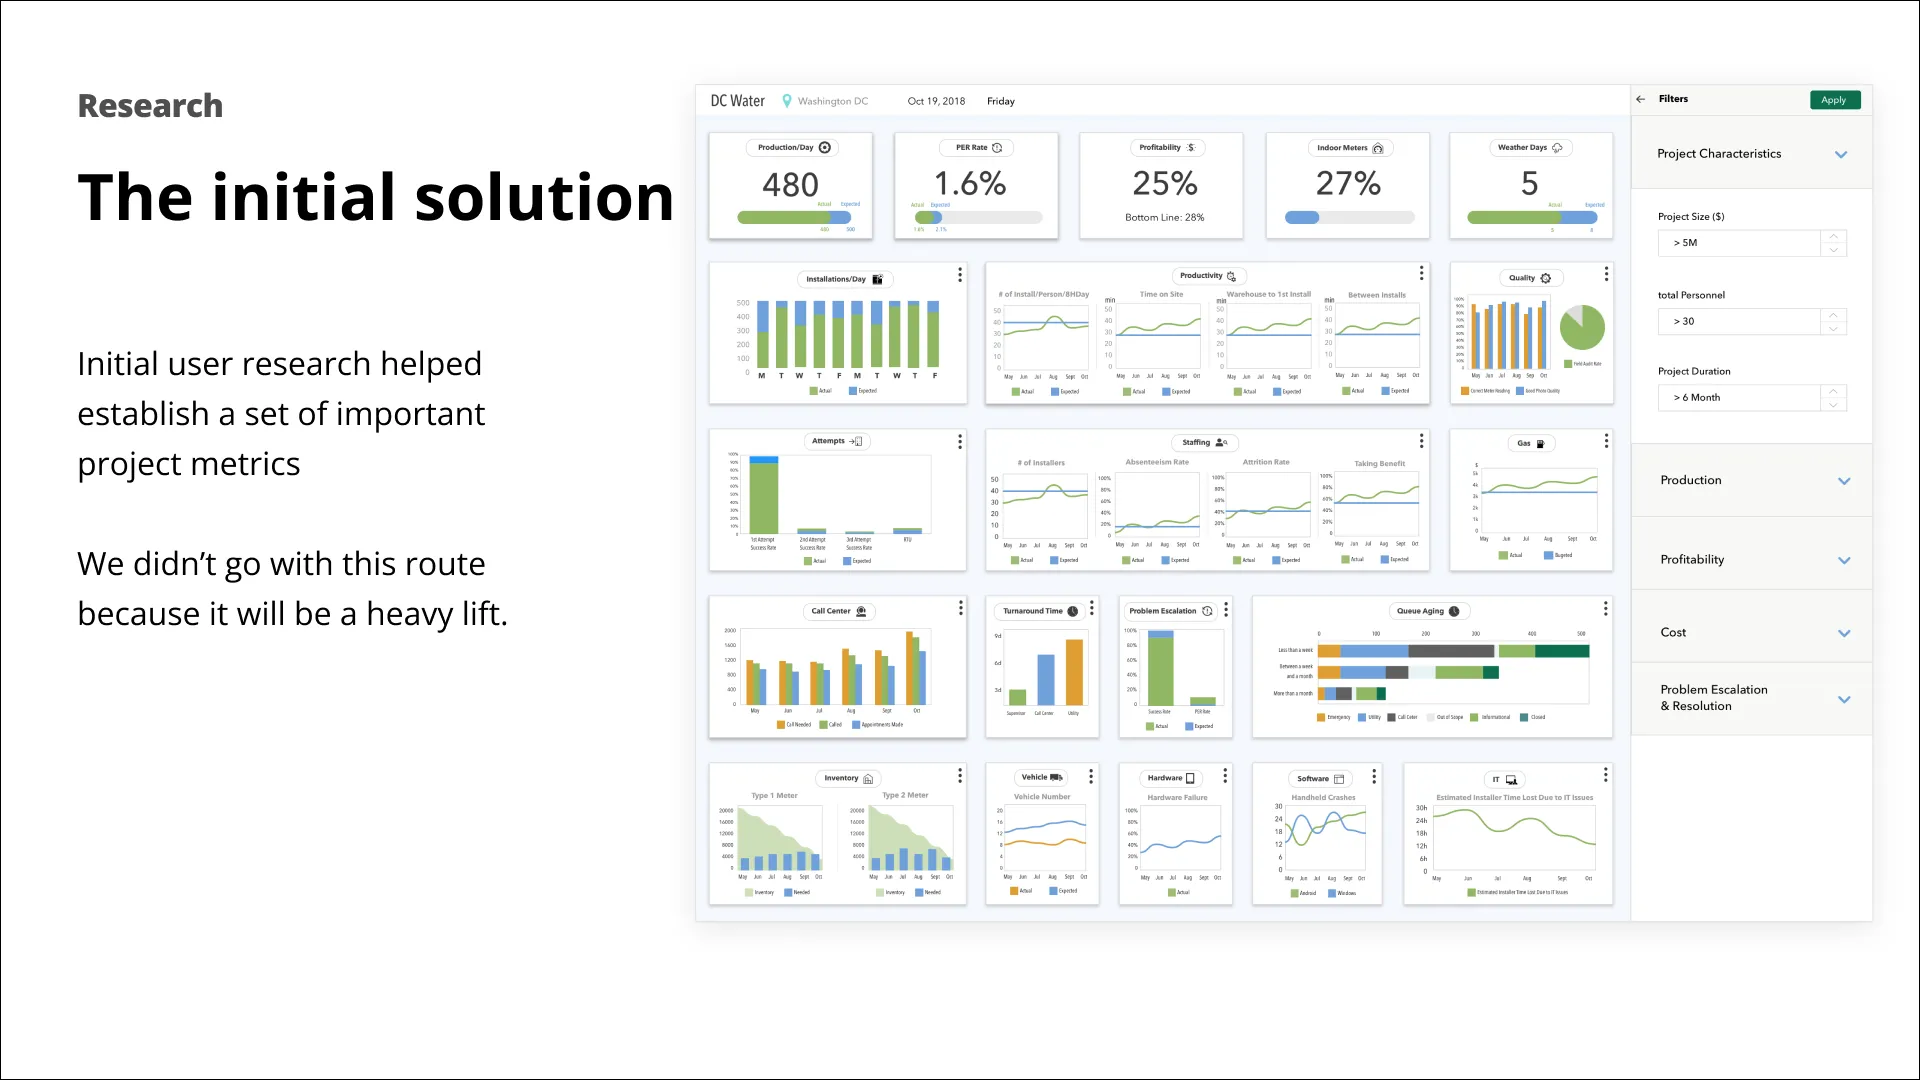
Slide: the initial solution — a single dense dashboard of every project metric with filters, set aside as too heavy a lift

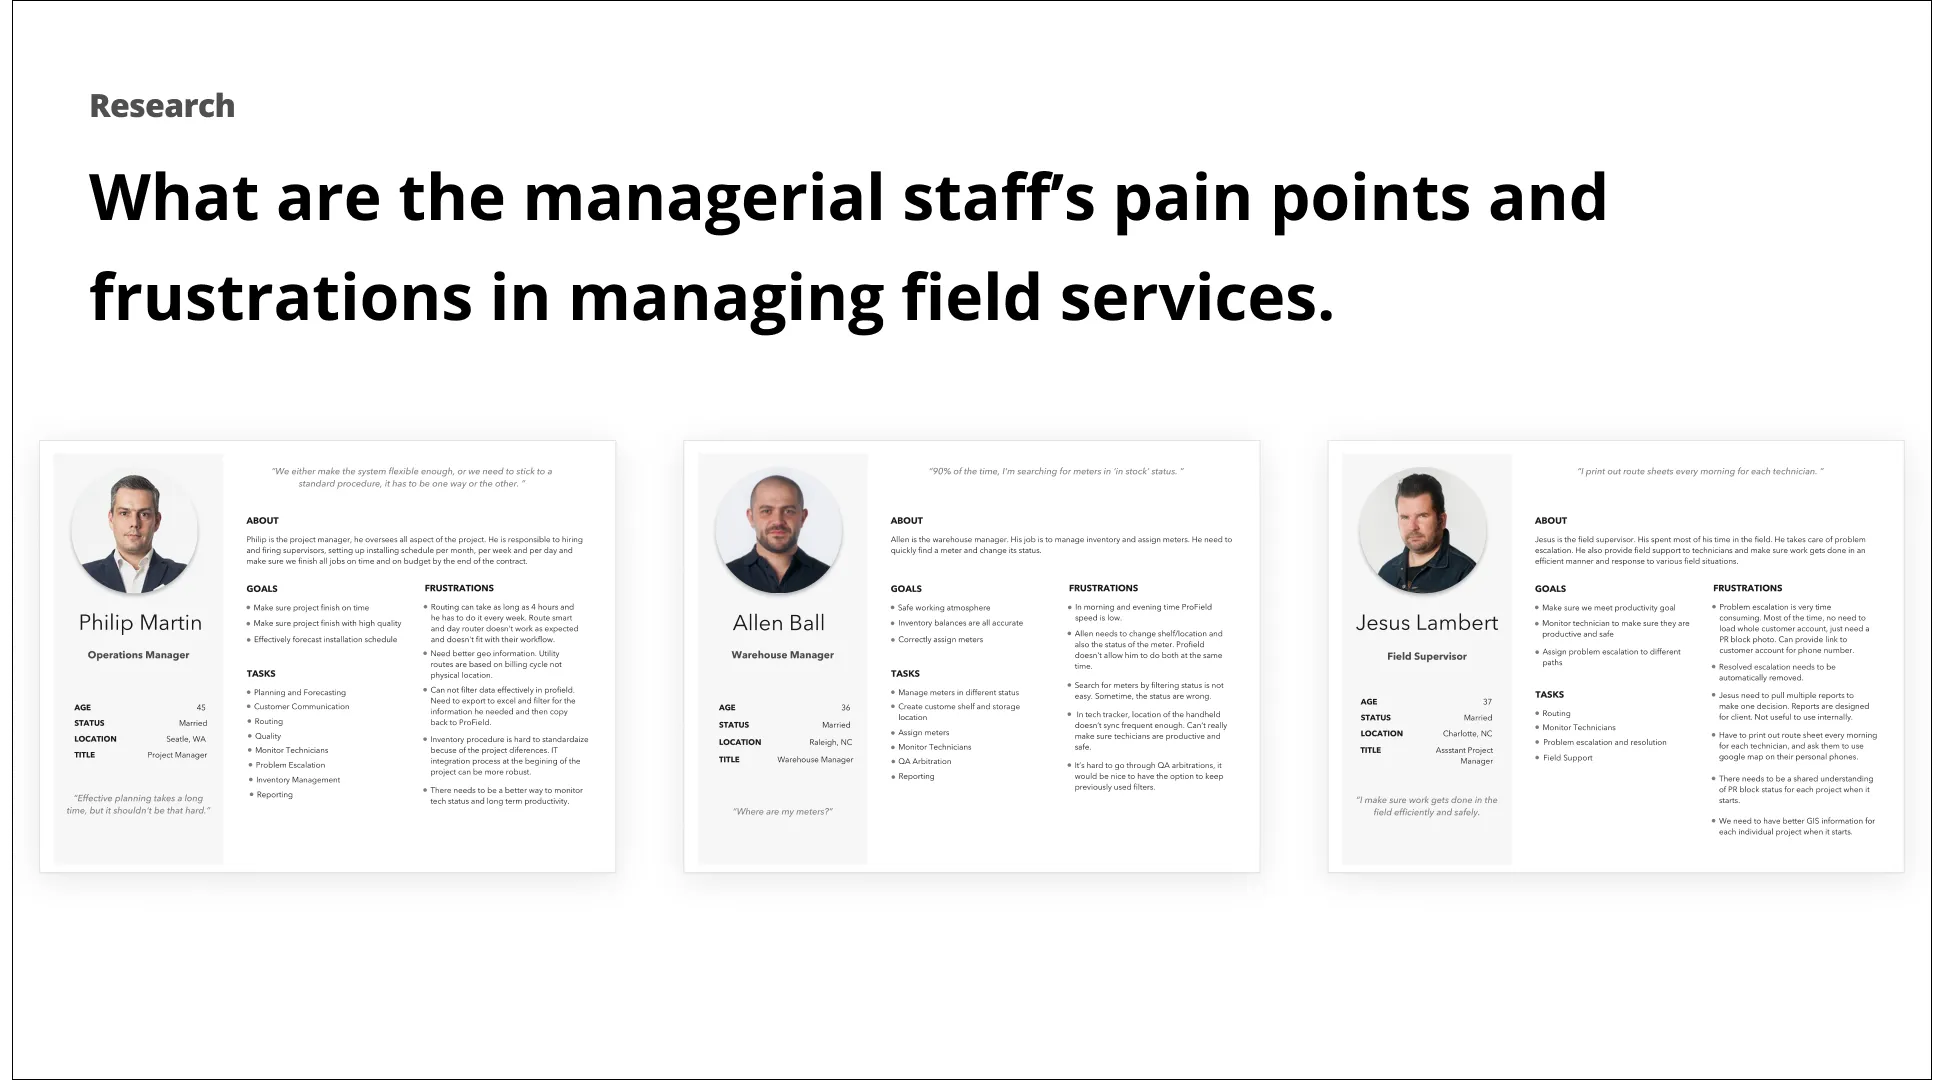
Slide: research — personas for the operations manager, warehouse manager, and field supervisor with goals, tasks, and frustrations

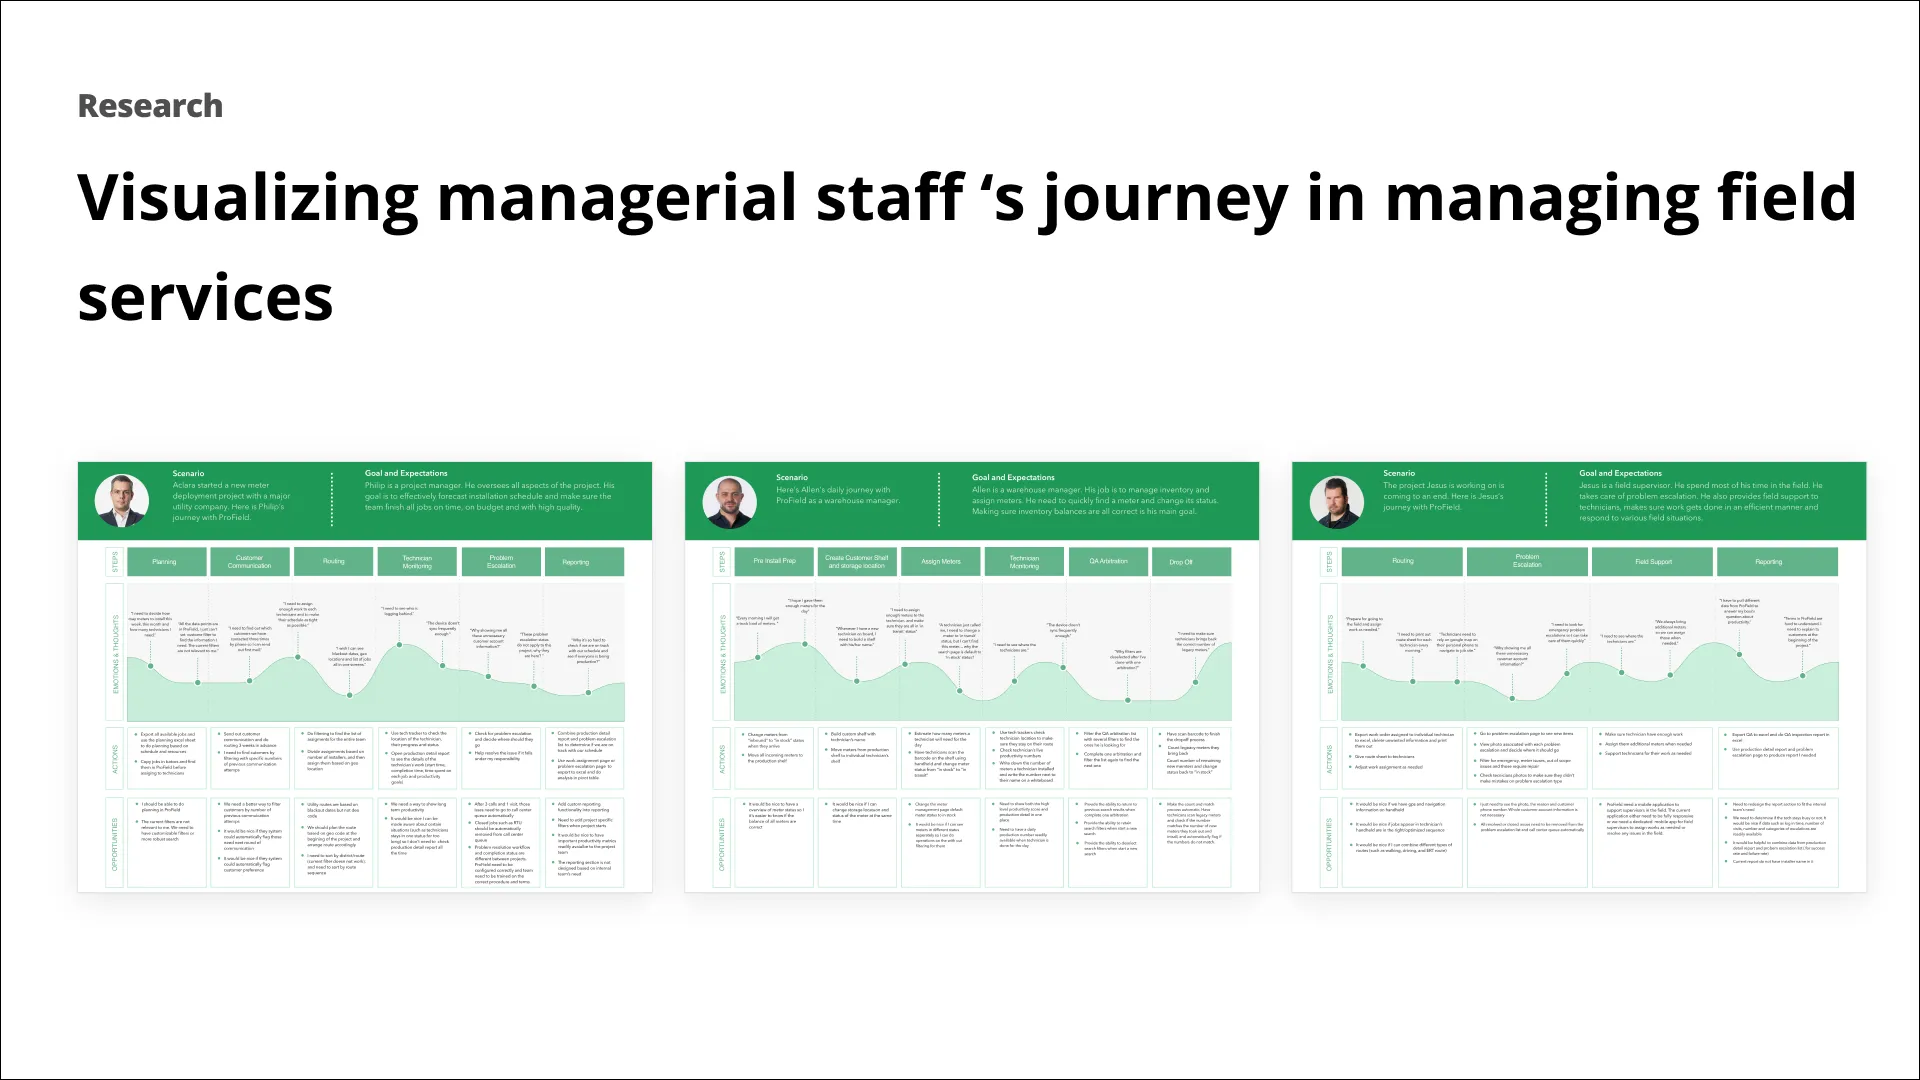
Slide: research — journey maps for the three managerial personas across steps, emotions, actions, and opportunities

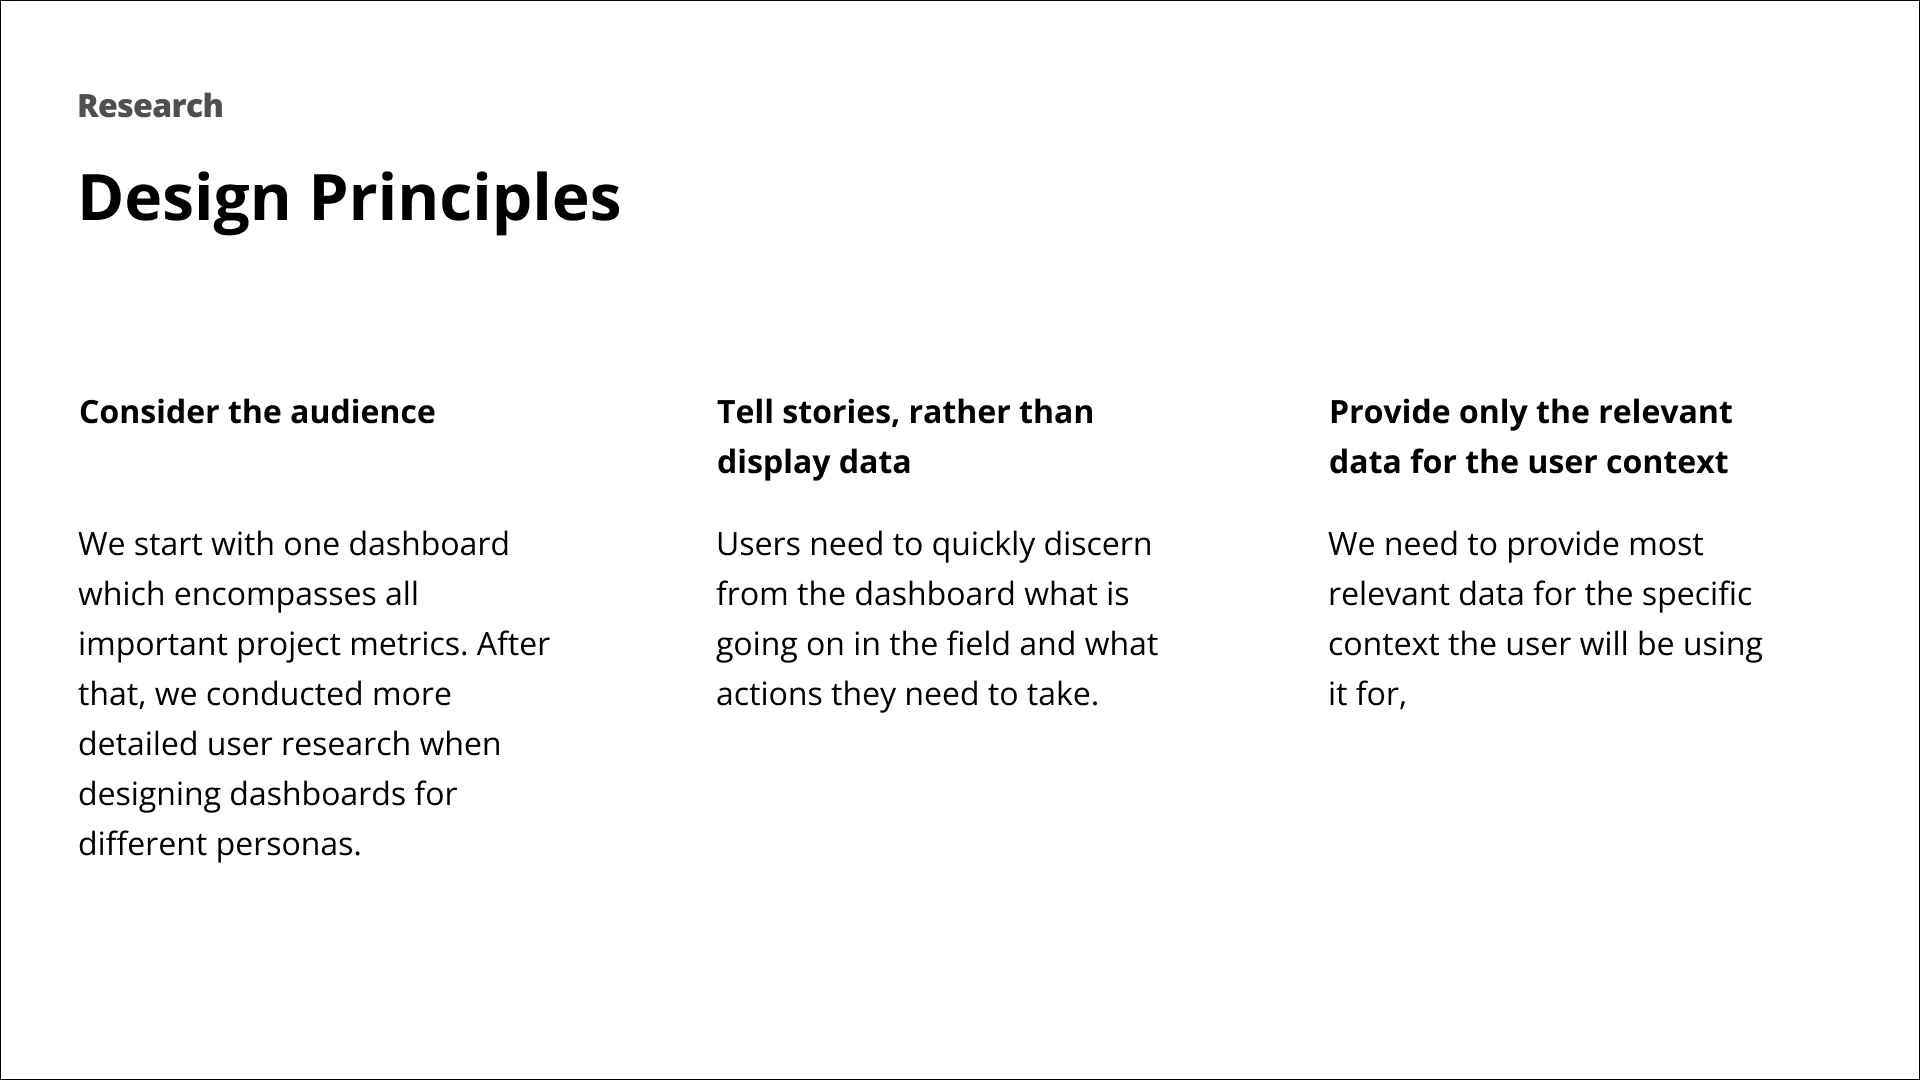
Slide: design principles — consider the audience, tell stories rather than display data, provide only context-relevant data

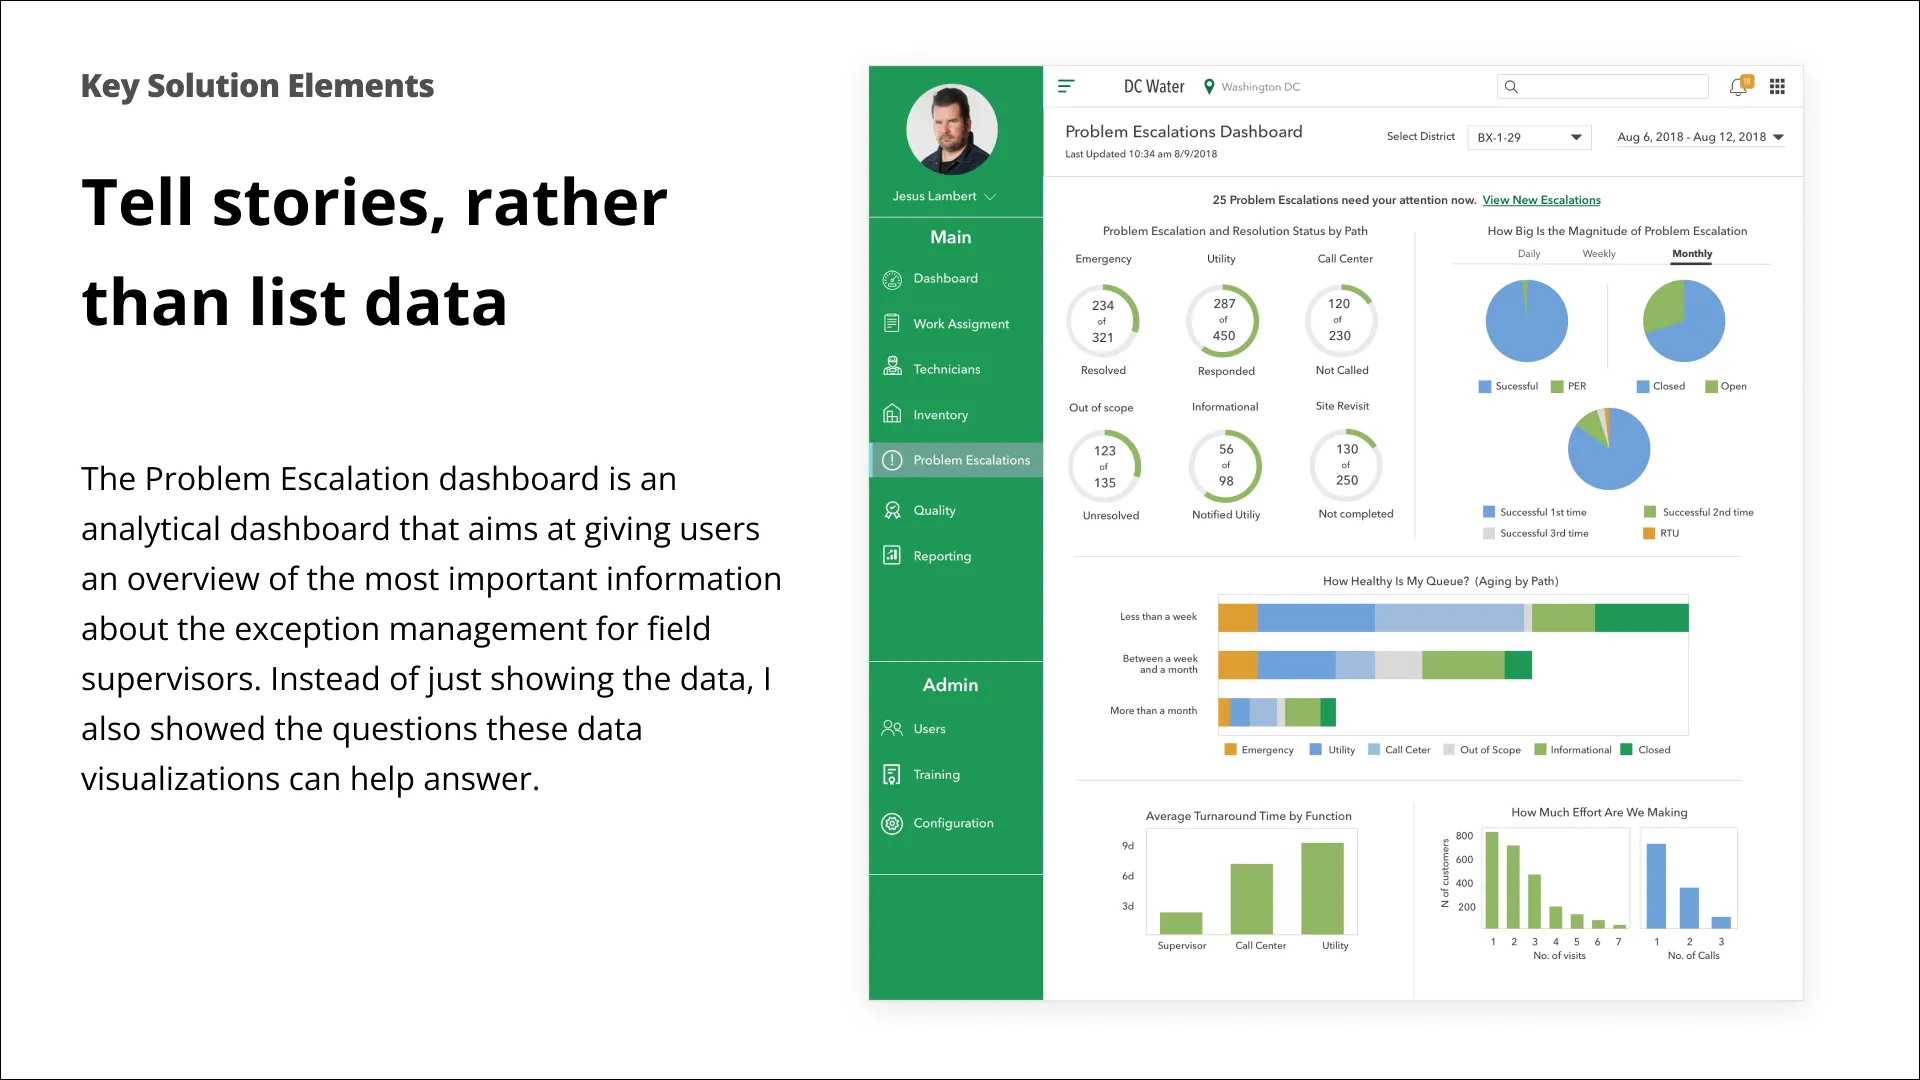
Slide: Problem Escalations dashboard telling a story — status by path, magnitude, queue aging, turnaround time, and effort

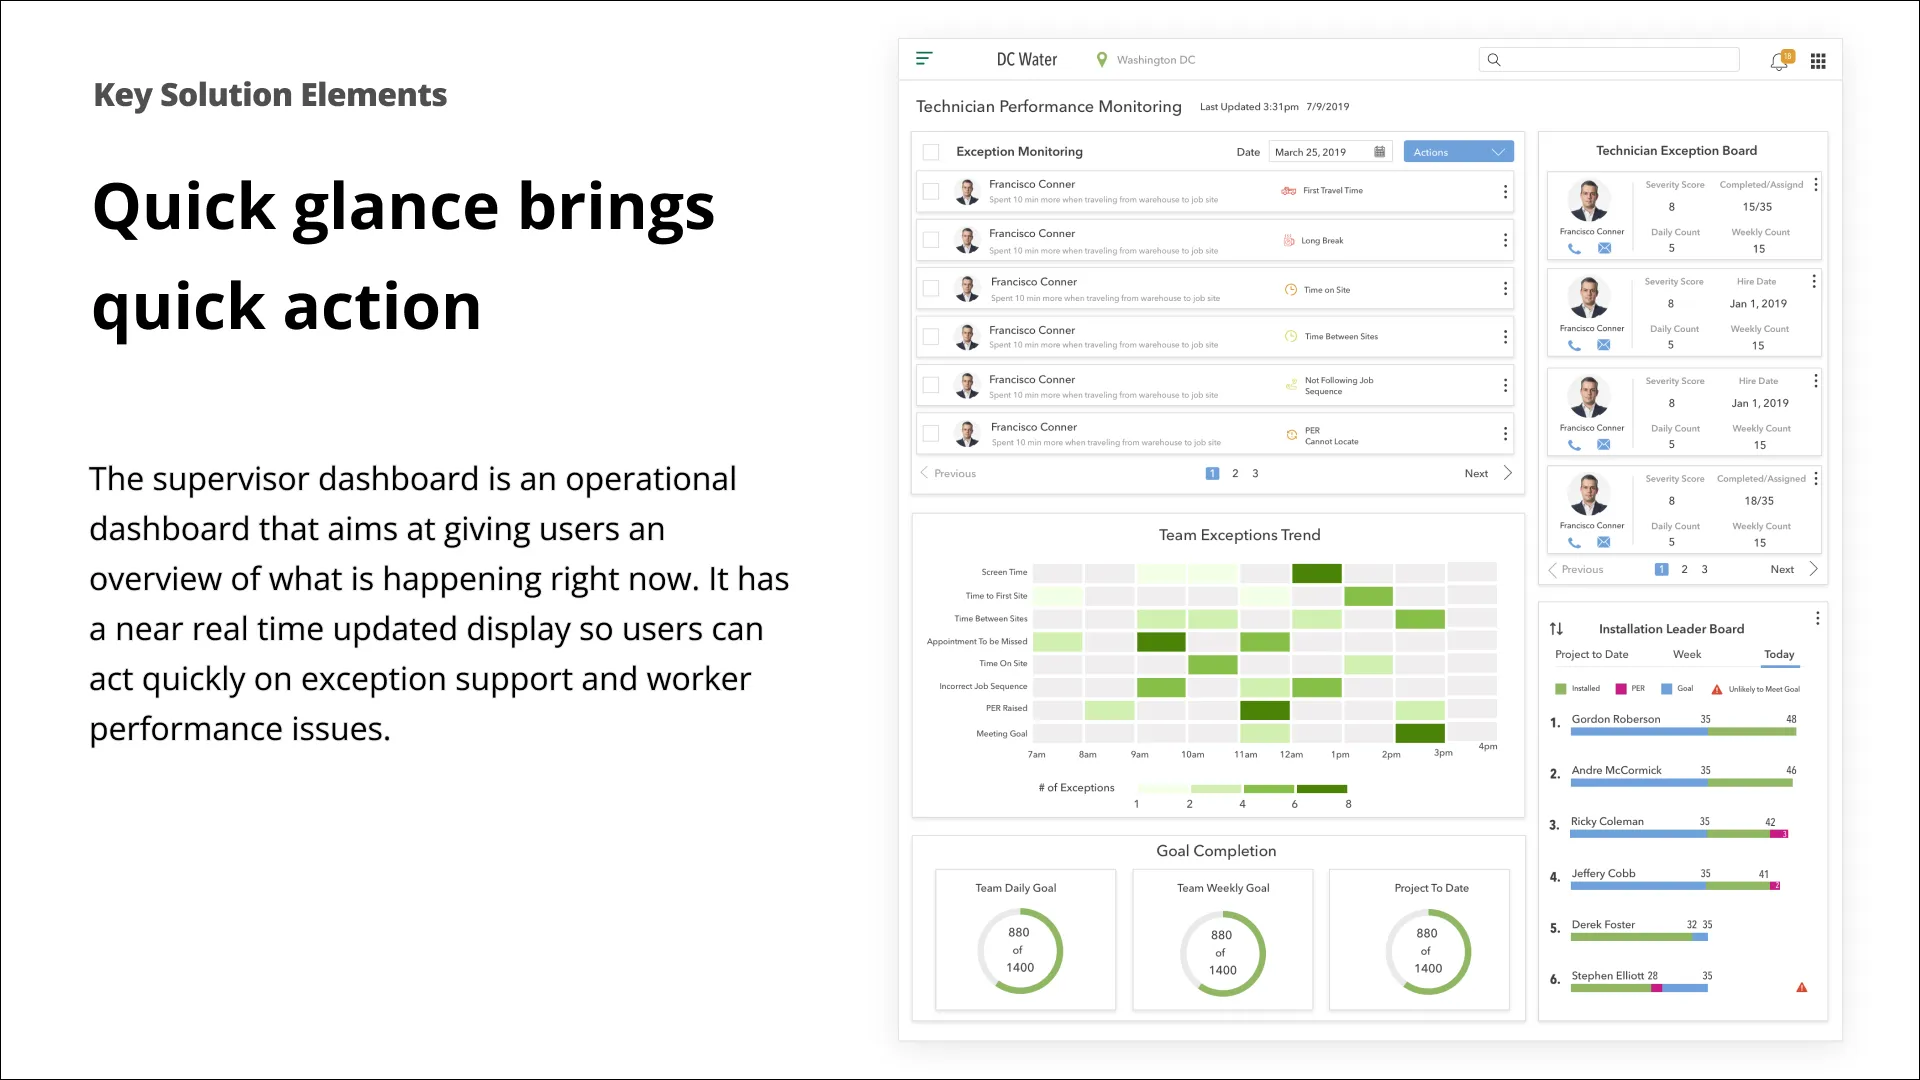
Slide: supervisor dashboard for quick action — exception monitoring, technician exception board, team exception trends, and goal completion

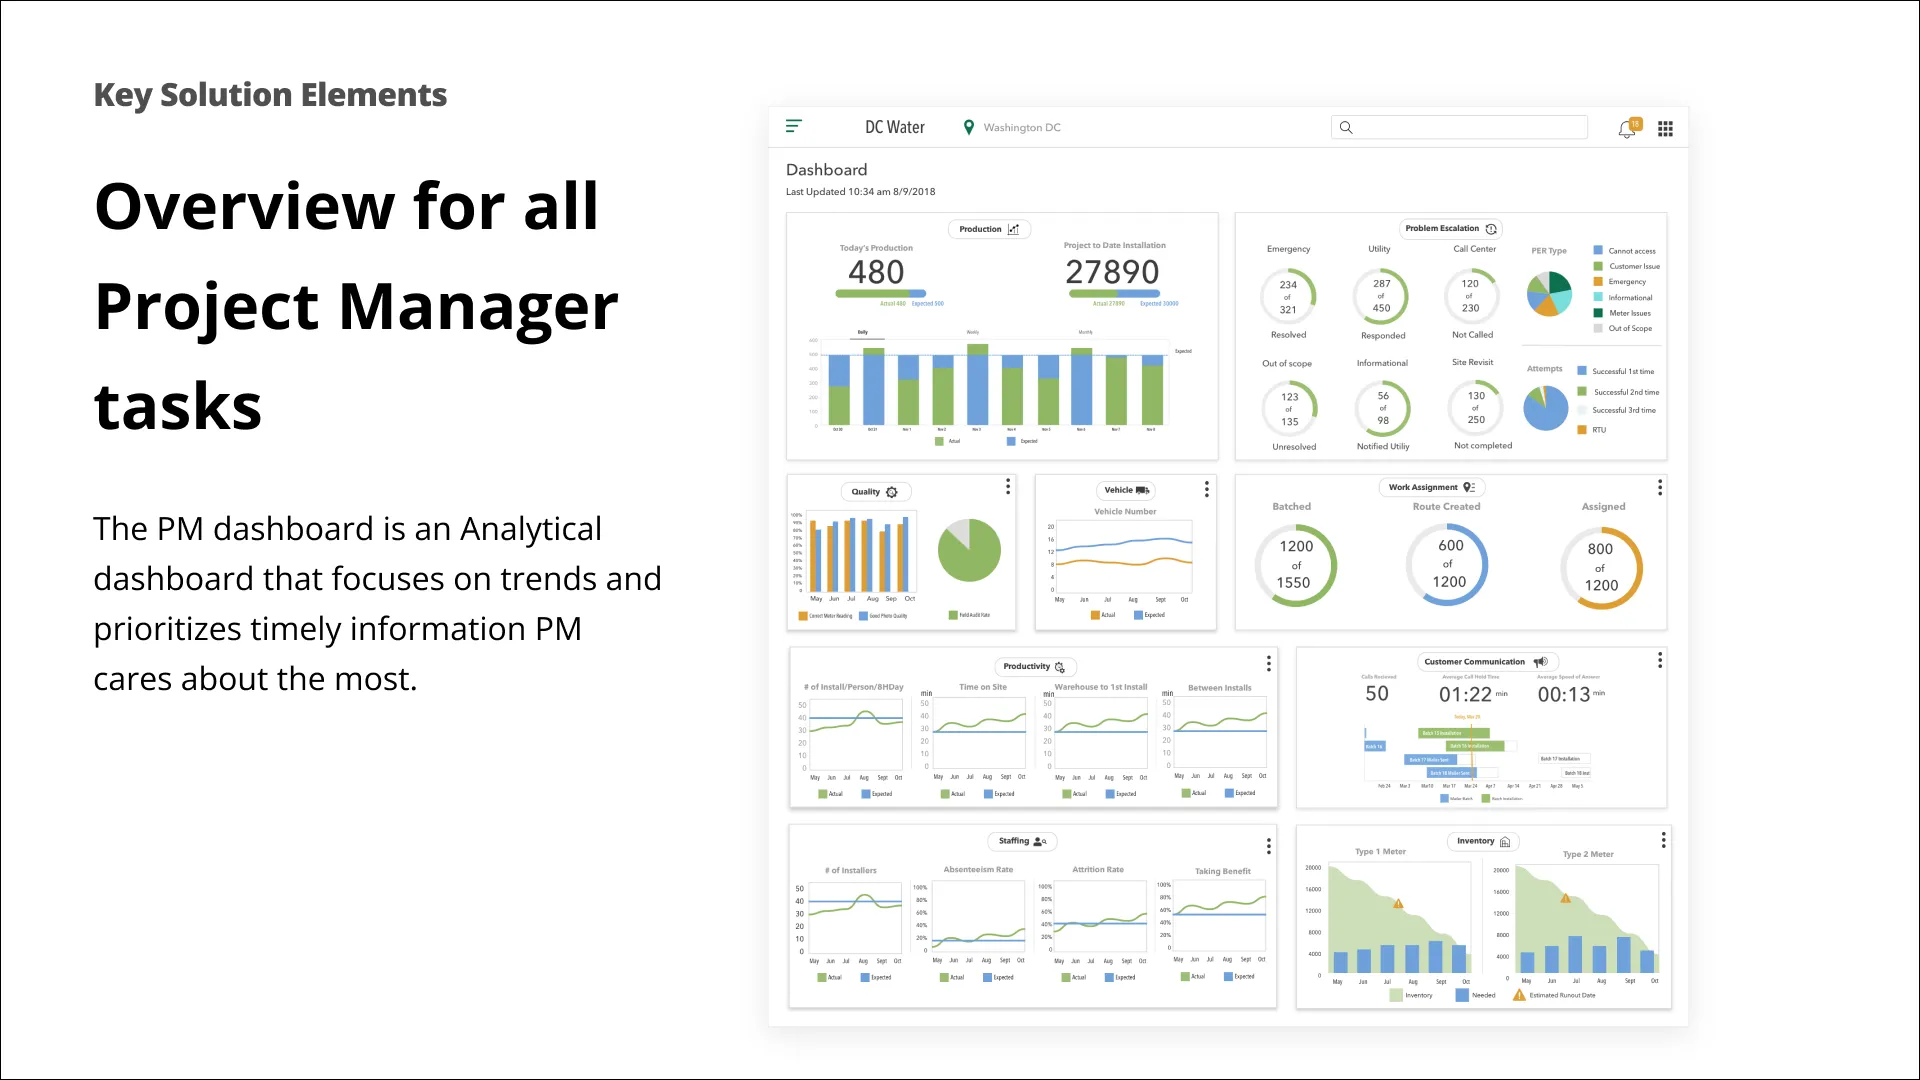
Slide: project manager dashboard overview — production, problem escalation, quality, productivity, staffing, and inventory trends

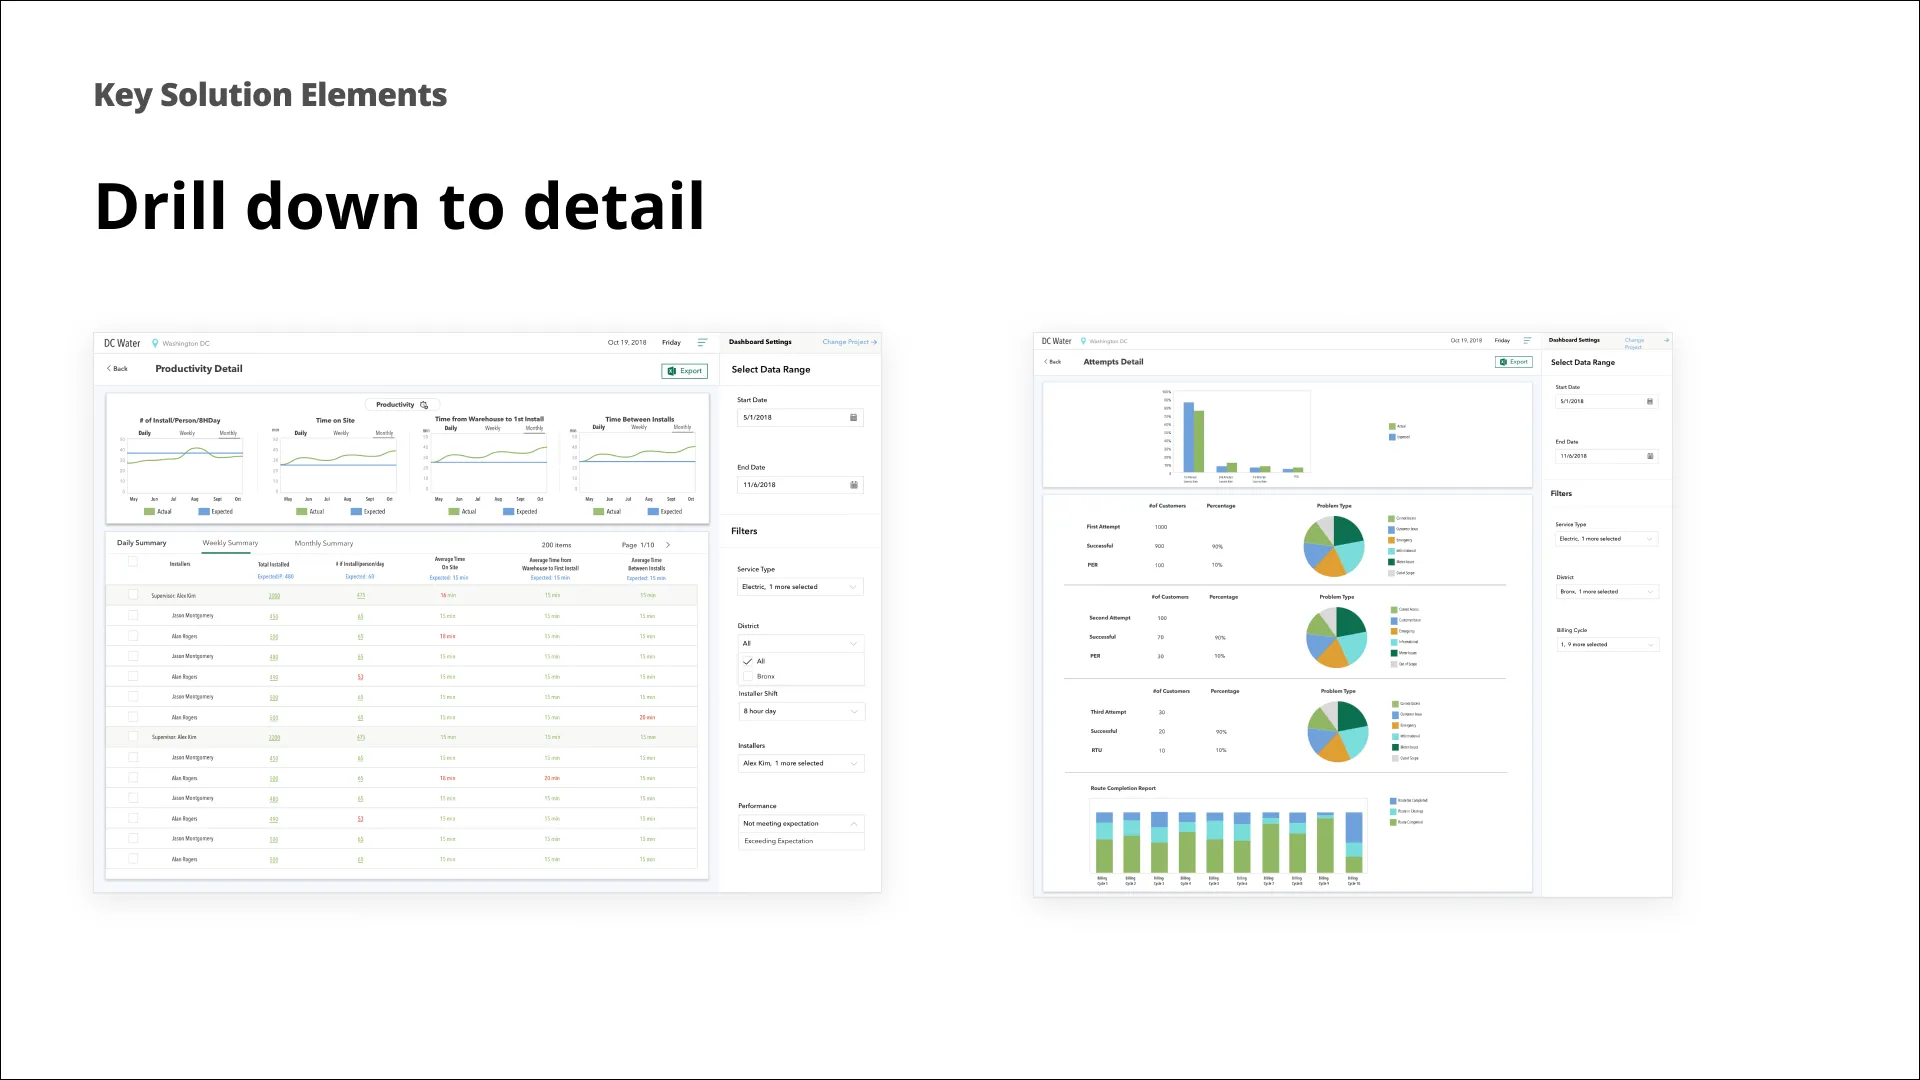
Slide: drill-down detail views — productivity detail with per-installer summaries and attempts detail with filters

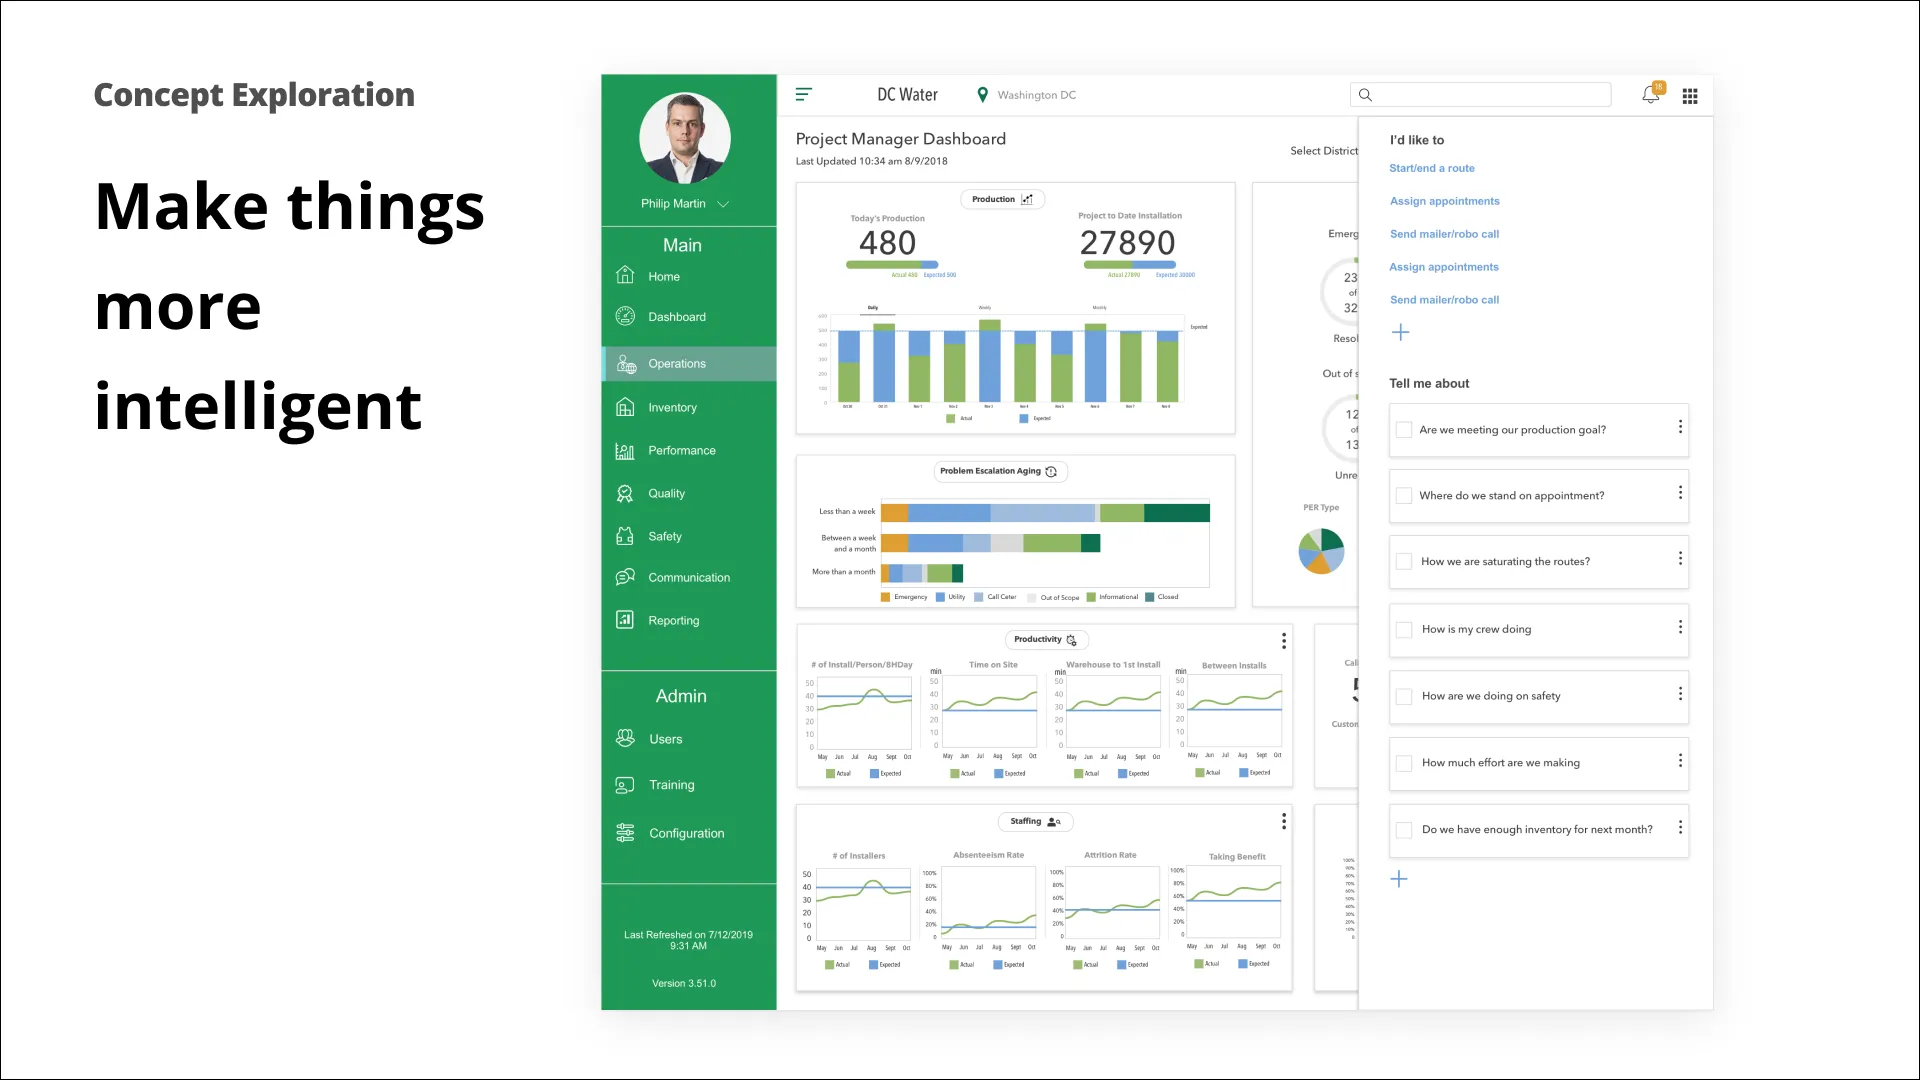
Slide: concept exploration — an intelligent dashboard with quick actions and natural-language "tell me about" questions

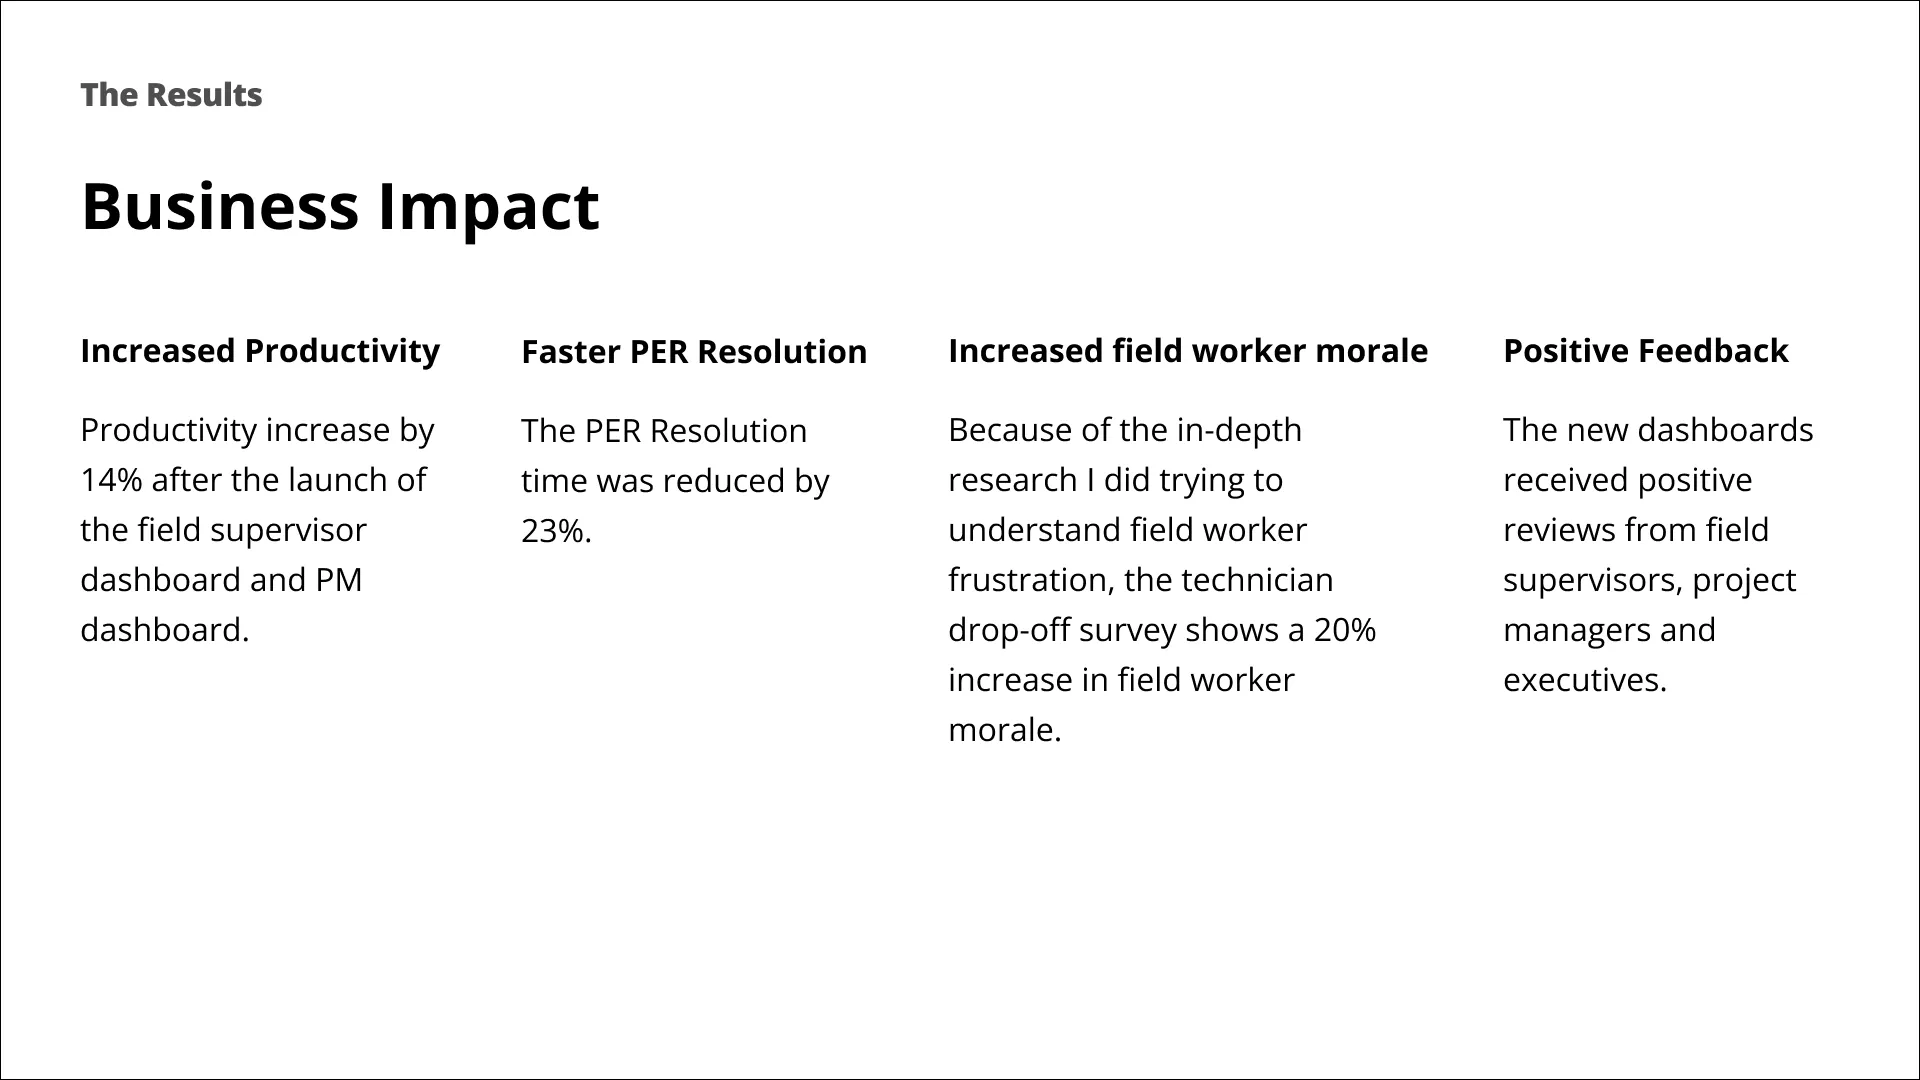
Slide: business impact — 14% productivity increase, 23% faster PER resolution, 20% higher field worker morale, positive feedback